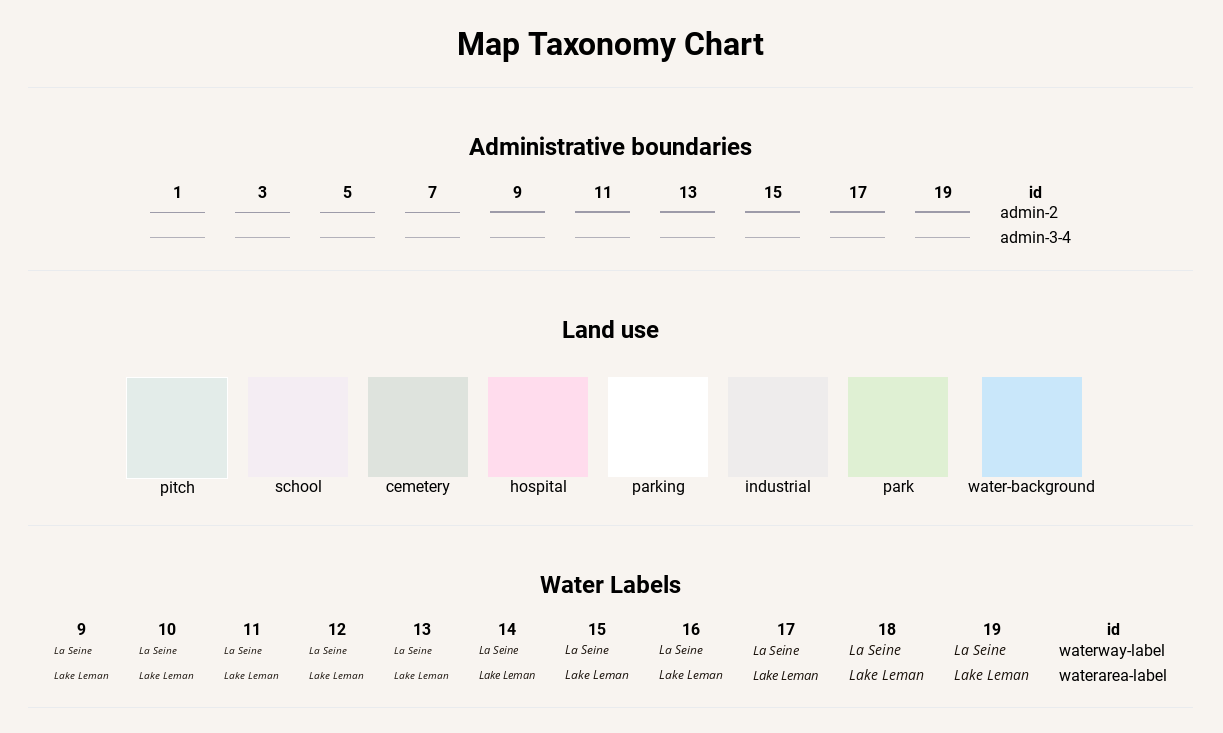
Map taxonomy chart
Taxonomy
Map taxonomy chart for mapbox GL styles.
Thanks Nath Slaughter @natslaughter for the original article and idea of taxonomy.
Read the original article here
Read the new article about this tool here
GitHub Page and Live Demo

Usage
Simple page
For a simple view of your taxonomy chart, you can use our demo on github. Here is the link and what it should look like :
https://jawg.github.io/taxonomy/demo?url=<your-style-url>
Without style url in the query parameter, it will show our simple example.
Web integration
You can add your taxonomy chart in your website or blog by using this code in your HTML :
<head>
  <link rel="stylesheet" type="text/css" href="https://jawg.github.io/taxonomy/dist/style.css">
</head>

<body>
  <taxonomy style-url="<your-style-url>"></taxonomy>
  <script src="https://jawg.github.io/taxonomy/dist/taxonomy-bundle+riot.js"></script>
</body>
Specification
Global metadata
{
  "metadata": {
    "taxonomy:title": "Global taxonomy title",
    "taxonomy:groups": [
      {
        "id": "admin-boundaries",
        "type": "line",
        "title":"Administrative boundaries"
      },
      {
        "id": "roads",
        "type": "line",
        "title":"Roads",
        "zooms": {
          "minzoom": 5,
          "maxzoom": 20
        }
      },
      {
        "id": "landcover",
        "type": "polygon",
        "title":"Water & Landcover",
        "zooms": 13
      },
      {
        "id": "places",
        "type": "symbol",
        "title":"Political & Place Labels",
        "zooms": [2, 4, 6, 8, 10, 12, 14, 16]
      },
      {
        "type": "annotation",
        "content": "<div style='font-size: 12px; text-align: center;'>Annotation for ending</a></div>"
      }
    ]
  }
}
taxonomy:groups
taxonomy:title: This is the title that will be displayed on the top of your taxonomy.taxonomy:groups: This an array of objects in your stylemetadata.Requiredid: This is the identifier for your taxonomy group. This will be use for your layer grouping.Required.type: This is the type of your style object. This is use for the taxonomy rendering. One ofline,polygon,symbolandannotation.Required.title: This is the title that will be displayed for your taxonomy group.zooms: This is all zoooms where taxonomy will be computed. Can bearray,number,object. Default zooms from 1 to 19.- Examples:
array:[0, 2, 4, 6, 8, 10, 12, 14],[5, 6, 7, 8]…number:3,16…object:minzoomandmaxzoomare required{minzoom: 5, maxzoom: 20},{minzoom: 0, maxzoom: 12}…
- Examples:
Layers metadata
{
  "id": "layer-id",
  "ref": "layer-for-casing",
  "metadata": {
    "taxonomy:group": "taxonomy-groups-id",
    "taxonomy:casing": "layer-for-casing",
    "taxonomy:example": "Example for symbols",
    "taxonomy:matches": [
      { "name": "meta-layer-name", "get:class": "value-from-tile", "example": "Example for symbols" }
    ]
  }
}
taxonomy:group: This must match ataxonomy:groups.idfrom your global metadata.Required.taxonomy:casing: This will refer to another layer id. That’s mean the current layer is the casing of the layer pointed bytaxonomy:casing. This layer must be a line type. This will render an outline fortaxonomy:casing(We can also userefid from your layer).taxonomy:example: This is a text example for symbols groups. Default text is layer id.taxonomy:matches: This is an array of objects that will process amatchorcaseexpression.name: The name or title to display for this example.example: The text to display if it’s a symbol.[expression]:[key]: The value to return when this expression is found, this should be a value that can be found in your tile. You can add many expressions.- Example
{"name": "Green Grass", "get:class": "grass"}will display Green Grass and replace occurences of["get", "class"]bygrass.
- Example
Concrete example
See example.json
Credits
Powered by JawgMaps
Sponsored by Qwant